IELTS Bar Chart Sample Essay
Static or Dynamic?
Before writing an IELTS task 1 bar chart or line graph answer it is important that we analyse the question correctly. Taking a few minutes to do this will help us write a clear answer that fully responds to the question. Just what the examiner wants us to do.
The first thing we need to do is decide if the bar chart is static or dynamic. Static means that the data comes from one point in time. Dynamic means the data comes from more than one point in time.
Whether a chart is static or dynamic will affect the information we choose to include in our answer and the kind of language (tense, grammar etc.) we use.
If it is dynamic we will have to compare the different times and comment on the general trends over the time period.
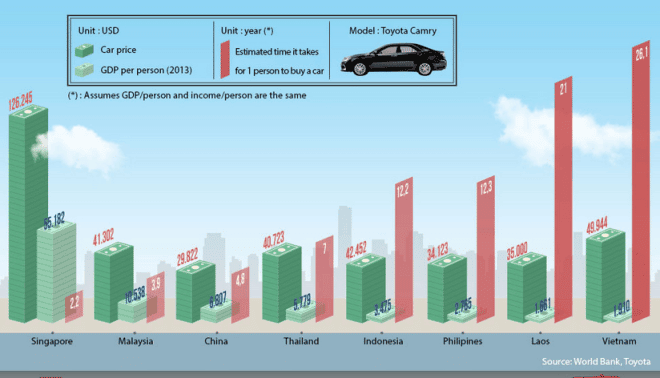
If it is static we will have to compare the different variables, in this case countries, car price, GDP and time it takes for one person to buy a car.
Main Features
Every IELTS academic task 1 question asks us to ‘select and report the main features’.
This means that we have to not only pick the most significant information from the graph and include it in our essay, but also decide which information is not important and should therefore not be included in our essay. One of the biggest mistakes you can make in task 1 is including all the information you see.
So which information should you choose?
You should look for:
- highest/lowest values
- biggest differences
- similarities
- significant exceptions
- anything else that really stands out
There are 3 main features in this graph
1) It takes over 26 years for a Vietnamese person to buy a car.
2) Vietnam has the second highest average costs but the second lowest wages.
3) Cost of a car in Singapore is nearly 3 times the next most expensive.
Structure
I advise my students to follow a basic four paragraph structure for these kinds of questions.
Paragraph 1
Paraphrase the question using synonyms.
Paragraph 2
Provide an overview of the main features. No need to include any data in this paragraph, just tell the examiner what is happening in general terms. If you had to describe the main features in two sentences, what would you say?
Paragraph 3
This is where we get more specific and use data. Take 2 of the main features (from your overview) and describe them in detail using data from the chart.
Paragraph 4
Simply do the same thing as you did in paragraph 3, but with two other main features (from your overview).
Sample Answer

The graph compares the GDP per capita, cost of a Toyota Camry and approximate length of time it takes for 1 citizen to purchase that mode of transport in eight Asian countries.
Despite having the second lowest average yearly income, it costs more to buy this car in Vietnam than in all but one other Asian nation. It also takes significantly longer for a standard person to buy an automobile in Vietnam than in any other state in Asia. On the other end of the scale, Singaporeans have to pay nearly three times more for their cars than the Vietnamese and it takes them the least amount of time to afford a motor vehicle.
It costs $49,944 to buy a Toyota Camry in Vietnam, but this dwarfs the average yearly income per person at just $1,910. It would therefore take a normal man or woman 26.1 years to save up for that particular car.
This is in contrast to Singapore where it costs $126,245 for that model of motorcar, however the average salary is much greater at $55,182. This means that it generally takes just over 2 years for a typical individual from Singapore to acquire this vehicle.
(200 words) Band 9.
It should be noted that this is not a real IELTS task 1 question. This is just a chart that I saw on the internet, but it allowed me to make a very important point- you don’t have to mention everything on the graph. I only talked about 2 out of the 8 countries and I still wrote 200 words and answer the question fully. The key is finding the most significant data and not talking about anything else. Don’t worry, you won’t lose marks for not talking about everything, quite the opposite.
Vocabulary
This graph is also good for demonstrating how important it is to vary your vocabulary. There were four words that could have been overused in this essay- car, average, country and people. Instead of repeating them over and over again I used synonyms to show the examiner I have a wide vocabulary and gain extra marks. Here are the synonyms:
Car- Toyota Camry- automobile- vehicle- motor vehicle- motorcar
Average- approximate- normal- typical- standard
Country- countries- nation- state
People- citizen- man or woman- individual
Next Steps
Next time you see a chart or graph in a newspaper, in a textbook or on the internet, think about what the main features are and what common words would you have to vary with synonyms.
I hope you have found these tips useful. If you have any questions, let me know below.
